
2017-Current
Quick Links:
Automotive Employment NZ Ltd has posted employment statistics virtually every quarter since 2004 to current date.
Scroll down to read historical data and discover the consistency of employment opportunities throughout the years Labour Market Statistics:
Learn how truly stable New Zealand's unemployment rates have been over a long period.
Labour market statistics: September 2021 Quarter
Key facts
In the September 2021 quarter, compared with the previous quarter, the:
unemployment rate fell to 3.4 percent, down from 4.0 percent
underutilisation rate fell to 9.2 percent, down from 10.5 percent
employment rate rose to 68.8 percent, up from 67.6 percent.
In the year to the September 2021 quarter:
wage rates increased 2.4 percent
average weekly earnings (for full-time equivalent employees (FTEs), including overtime) increased to $1,367
average ordinary time hourly earnings rose to $35.25.
Labour market statistics: September 2020 Quarter
Key facts
Unemployment rate rose to 5.3 percent
Underutilisation rate rose to 13.2 percent.
Employment rate fell to 66.4 percent.
Filled jobs fell 0.4 percent quarterly.
Actual hours worked showed recovery, rising 9.4 percent since last quarter.
Average ordinary time hourly earnings rose to $33.81.
Wage rates increased 1.9 percent annually in the labour cost index.
Employment at a glance (seasonally adjusted) | Sep 2020 | Quarterly | Annual | |
Percent | Percentage points | |||
Unemployment rate | 5.3 | 1.3 | 1.1 | |
Underutilisation rate | 13.2 | 1.2 | 2.8 | |
Employment rate | 66.4 | -0.7 | -1.3 | |
Labour force participation rate | 70.1 | 0.2 | -0.5 | |
(000) | Percent | |||
Unemployed | 151 | 32.5 | 28.5 | |
Employed | 2,709 | -0.8 | 0.2 | |
Filled jobs | 1,980 | -0.4 | 0.0 | |
Working-age population | 4,079 | 0.3 | 2.2 | |
Wages at a glance | Index | Percent | ||
Wage inflation (salary and wage rates, including overtime) | All sectors | 1225 | 0.6 | 1.9 |
Private sector | 1227 | 0.4 | 1.6 | |
Summary
In the September 2020 quarter, unemployment had the largest quarterly rise since the series began in 1986. The sharp rise in unemployed indicates people without a job are starting to actively seek work, after being unable to in the June 2020 quarter due to the lockdown. The number of people not in the labour force has fallen this quarter.
Employment had the biggest quarterly fall since the March 2009 quarter.
Underutilisation rose this quarter, driven by the large increase in unemployed and a smaller increase in underemployed. The potential labour force fell.
Hours rose this quarter, after steep falls last quarter when the country was in lockdown. Actual hours in the household labour force survey (HLFS), and weekly hours per FTE and gross paid hours in the quarterly employment survey (QES) all lifted from the June 2020 quarter. However, all remained slightly lower annually.
The QES and the labour cost index (LCI) showed wage growth both over the quarter and over the year.
Unemployment
The seasonally adjusted unemployment rate rose to 5.3 percent in the September 2020 quarter, up from 4.0 percent in the June 2020 quarter.
For men, the unemployment rate rose to 4.8 percent, up from 3.6 percent.
For women, the unemployment rate rose to 5.8 percent, up from 4.5 percent.
The seasonally adjusted number of unemployed people rose to 151,000 (up 37,000 from last quarter).
19,000 more men were unemployed.
18,000 more women were unemployed.
Where data has not been seasonally adjusted, annual movements are used instead of quarterly.
Unadjusted data shows the following significant annual movements in the number of unemployed by age group:
9,100 more unemployed 15–24-year-olds
6,000 more unemployed 25–34-year-olds
5,500 more unemployed 35–44-year-olds
4,500 more unemployed 45–54-year-olds
6,100 more unemployed 55–64-year-olds.
There were no significant annual changes in unemployment amongst those aged 65 and over.
Labour market statistics: June 2020 Quarter
Unemployment drops to 4% during Covid-19
Key facts
Labour market at a glance
Unemployment rate fell to 4.0 percent.
Underutilisation rate rose to 12.0 percent.
Employment rate fell to 66.9 percent.
Filled jobs fell 0.5 percent.
Average weekly earnings (including overtime) fell 2.8 percent
Wage rates increased 2.1 percent annually.
Summary
In the June 2020 quarter, unemployment and employment both fell, as more people were not in the labour force.
Underutilisation rose this quarter, as unemployment falls were outweighed by rises in underemployment (people working part-time who wanted and were available to increase their hours) and available potential jobseekers (jobless people who would have been unemployed if they had been actively looking for work).
Hours fell far more sharply than employment, reflecting reduced hours worked during lockdown by people who remained employed. Hours paid for by businesses in the quarterly employment survey (QES) fell less than hours actually worked in the household labour force survey (HLFS), as many businesses were able to continue to pay some or all wages over the quarter.
Wages remained relatively static when quality and quantity controlled in the labour cost index (LCI), buoyed primarily by April’s minimum wage increase, but weekly earnings per FTE dropped sharply in the QES, as steady hourly pay could not compensate for falling weekly hours.
Note: Labour force status classifications unchanged in response to COVID-19
Stats NZ adheres to best practice and required standards set by the International Labour Organization (ILO). These standards have not been changed in response to COVID-19 to ensure international comparability and consistency of estimates.
Note: population reweight
This release incorporates revisions to historical household labour force survey data from the September 2018 quarter to the March 2020 quarter to account for the latest national population estimates. As such, figures published this quarter may differ from those previously published.
Unemployment
The seasonally adjusted unemployment rate fell to 4.0 percent in the June 2020 quarter, down from 4.2 percent last quarter.
For men, the unemployment rate fell to 3.6 percent, down from 4.0 percent last quarter.
For women, the unemployment rate rose to 4.4 percent, up from 4.3 percent.
The seasonally adjusted number of unemployed people fell to 111,000 (down 6,000).
7,000 fewer men were unemployed.
1,000 more women were unemployed.
The fall in the number of unemployed people coincided with a rise of 37,000 people not in the labour force.
Underutilisation
The seasonally adjusted underutilisation rate rose to 12.0 percent this quarter, up from 10.4 percent last quarter. This was the largest quarterly rise recorded since the series began in 2004.
For men, the underutilisation rate rose to 9.4 percent, up from 8.3 percent.
For women, the underutilisation rate rose to 14.9 percent, up from 12.7 percent.
Labour market statistics: March 2020 Quarter
Key facts
Unemployment rate rose to 4.2 percent.
Underutilisation rate rose to 10.4 percent.
Employment rate rose to 67.5 percent.
Filled jobs increased 1.9 percent annually.
Average ordinary time hourly earnings rose to $33.14.
Wage rates increased 2.5 percent annually.
Note: impact of COVID-19 on data collection
COVID-19 lockdown and labour market statistics for March and June 2020 quartershas information about the impact of COVID-19 on the collection of labour market statistics.
| Employment at a glance (seasonally adjusted) | Mar 2020 quarter | Quarterly change | Annual change | |||||||||||
|---|---|---|---|---|---|---|---|---|---|---|---|---|---|---|
| Percent | Percentage points | |||||||||||||
| Unemployment rate | 4.2 | 0.2 | 0.1 | |||||||||||
| Underutilisation rate | 10.4 | 0.4 | -0.9 | |||||||||||
| Employment rate | 67.5 | 0.2 | 0.1 | |||||||||||
| Labour force participation rate | 70.4 | 0.3 | 0.1 | |||||||||||
| (000) | Percent | |||||||||||||
| Unemployed | 116 | 4.4 | 2.7 | |||||||||||
| Employed | 2,661 | 0.7 | 1.6 | |||||||||||
| Filled jobs | 2,002 | 1.0 | 1.9 | |||||||||||
| Working-age population | 3,944 | 0.4 | 1.5 | |||||||||||
| Wages at a glance | Index | Percent | ||||||||||||
| Wage inflation (salary and wage rates, including overtime) | All sectors | 1215 | 0.3 | 2.5 | ||||||||||
| Private sector | 1219 | 0.3 | 2.4 | |||||||||||
| Public sector | 1203 | 0.5 | 3.2 | |||||||||||
| LCI analytical unadjusted | 1390 | 0.6 | 3.8 | |||||||||||
| Dollars | Percent | |||||||||||||
| Average ordinary time hourly earnings | 33.14 | 1.2 | 3.6 | |||||||||||
| Hours at a glance (figures seasonally adjusted) | Hours | Percent | ||||||||||||
| Average weekly paid hours for FTEs (QES) | Ordinary time | 37.93 | 0.0 | -0.1 | ||||||||||
| Total | 38.66 | -0.1 | -0.3 | |||||||||||
| (millions) | Percent | |||||||||||||
| Total weekly paid hours (QES) | 62.8 | 0.6 | 1.9 | |||||||||||
| Total actual weekly hours worked (HLFS) | 90.3 | 0.8 | 0.1 | |||||||||||
| Note: | LCI – labour cost index QES – quarterly employment survey HLFS – household labour force survey | FTEs – full-time equivalent employees | ||||||||||||
Note: population reweight
Labour market statistics: December 2019 quarter
Key facts
Labour market at a glance
Unemployment rate fell to 4.0 percent.
Underutilisation rate fell to 10.0 percent.
Employment rate fell to 67.3 percent.
Filled jobs increased 0.9 percent annually.
Average ordinary time hourly earnings rose to $32.76.
Wage rates increased 2.6 percent annually.
Note: population reweight
On 27 January 2020, we revised all data from the household labour force survey (HLFS) to account for the latest subnational population estimates. Figures published this quarter may differ from those previously published.
| Employment at a glance (seasonally adjusted) | Dec 2019 quarter | Quarterly change | Annual change | |
|---|---|---|---|---|
| Percent | Percentage points | |||
| Unemployment rate | 4.0 | -0.1 | -0.3 | |
| Underutilisation rate | 10.0 | -0.4 | -2.1 | |
| Employment rate | 67.3 | -0.2 | -0.3 | |
| Labour force participation rate | 70.1 | -0.3 | -0.5 | |
| (000) | Percent | |||
| Unemployed | 111 | -2.5 | -5.8 | |
| Employed | 2648 | 0.0 | 1.0 | |
| Filled jobs | 1981 | 0.1 | 0.9 | |
| Working-age population | 3937 | 0.4 | 1.4 | |
| Wages at a glance | Index | Percent | ||
| Wage inflation (salary and wage rates, including overtime) | All sectors | 1211 | 0.7 | 2.6 |
| Private sector | 1215 | 0.6 | 2.4 | |
| Public sector | 1197 | 0.9 | 3.3 | |
| LCI analytical unadjusted | 1382 | 0.9 | 3.9 | |
| Level | Percent | |||
| Average ordinary time hourly earnings | 32.76 | 0.3 | 3.6 | |
| Hours at a glance (figures seasonally adjusted) | Hours | Percent | ||
| Average weekly paid hours for FTEs (QES) | Ordinary time | 37.92 | 0.1 | 0.0 |
| Total | 38.69 | 0.2 | 0.0 | |
| (millions) | Percent | |||
| Total weekly paid hours (QES) | 62.4 | 0.6 | 1.6 | |
| Total actual weekly hours worked (HLFS) | 89.8 | -0.5 | 0.5 | |
| Note: LCI – labour cost index QES – quarterly employment survey HLFS – household labour force survey FTE – full-time equivalent employees | ||||
Unemployment and underutilisation rates fall
The seasonally adjusted unemployment rate fell to 4.0 percent in the December 2019 quarter, down from 4.1 percent (revised) last quarter.
For men, the unemployment rate remained unchanged at 3.8 percent. For women, it fell to 4.3 percent, down from 4.5 percent last quarter.
The number of unemployed people fell to 111,000 (down 3,000) in the December 2019 quarter. This was driven by 3,000 fewer unemployed women.
The underutilisation rate fell to 10.0 percent in the December 2019 quarter, down from 10.4 percent last quarter.
This is the lowest underutilisation rate since the June 2008 quarter, when it was 9.9 percent.
For men, the underutilisation rate remained unchanged at 8.3 percent. For women, it fell to 11.8 percent, down from 12.6 percent last quarter.
This is the lowest underutilisation rate for women since the June 2008 quarter, when it was 11.6 percent.
In the December 2019 quarter, there were 11,000 fewer underutilised people – down to 285,000. This was driven by 12,000 fewer women who were underutilised.
The employment rate was unchanged in the September 2019 quarter at 67.5 percent.
Labour market statistics: September 2019 Quarter
Key facts
Unemployment rate rose to 4.2 percent.
Underutilisation rate fell to 10.4 percent.
Employment rate was unchanged at 67.5 percent.
Filled jobs rose 1.1 percent.
Average ordinary time hourly earnings rose to $32.65.
Wage rates increased 2.4 percent annually.
| Employment at a glance (seasonally adjusted) | Sep 2019 quarter | Quarterly change | Annual change | |
|---|---|---|---|---|
| Percent | Percentage points | |||
| Unemployment rate | 4.2 | 0.3 | 0.2 | |
| Underutilisation rate | 10.4 | -0.6 | -1.0 | |
| Employment rate | 67.5 | 0.0 | -0.5 | |
| Labour force participation rate | 70.4 | 0.1 | -0.4 | |
| (000) | Percent | |||
| Unemployed | 115 | 6.0 | 5.2 | |
| Employed | 2,641 | 0.2 | 0.9 | |
| Filled jobs | 1,980 | 0.4 | 1.1 | |
| Working-age population | 3,915 | 0.3 | 1.7 | |
| Wages at a glance | Index | Percent | ||
| Wage inflation (salary and wage rates, including overtime) | All sectors | 1202 | 0.8 | 2.4 |
| Private sector | 1208 | 0.6 | 2.3 | |
| Public sector | 1186 | 1.3 | 3.0 | |
| LCI analytical unadjusted | 1369 | 1.2 | 3.9 | |
| Level | Percent | |||
| Average ordinary time hourly earnings | $32.65 | 0.9 | 4.2 | |
| Hours at a glance (figures seasonally adjusted) | Hours | Percent | ||
| Average weekly paid hours for FTEs (QES) | Ordinary time | 37.86 | 0.2 | -0.5 |
| Total | 38.59 | 0.1 | -0.5 | |
| (millions) | Percent | |||
| Total weekly paid hours (QES) | 62.0 | 0.4 | 1.1 | |
| Total actual weekly hours worked (HLFS) | 89.8 | 0.5 | 2.1 | |
Unemployment rate rises, while underutilisation rate falls
The seasonally adjusted unemployment rate rose to 4.2 percent in the September 2019 quarter, up 0.3 percentage points from 3.9 percent last quarter.
The unemployment rate for men rose to 3.8 percent, up from 3.6 percent last quarter. The unemployment rate for women rose to 4.6 percent, up from 4.3 percent last quarter.
The number of unemployed people rose by 6,000 to reach 115,000 in the September 2019 quarter. This reflected 4,000 more unemployed women and 2,000 more unemployed men.
The seasonally adjusted underutilisation rate fell to 10.4 percent this quarter, down 0.6 percentage points from 11.0 percent last quarter.
This is the lowest rate of underutilisation since the June 2008 quarter, when it was 9.9 percent.
Underutilisation is a broader measure of spare capacity in New Zealand’s labour market. It is just as important as the unemployment rate, as it gives us a more detailed picture of the workforce.
The underutilisation rate for men fell to 8.3 percent, down from 9.1 percent last quarter. This is the lowest underutilisation rate for men since the December 2007 quarter, when it was 7.5 percent.
The underutilisation rate for women fell to 12.6 percent, down from 13.1 percent last quarter. This is the lowest underutilisation rate for women since the September 2008 quarter, when it was also 12.6 percent.
The employment rate was unchanged in the September 2019 quarter at 67.5 percent.
June 2019 Quarter Labour Market Survey
At just 3.9% New Zealand's can once again celebrate one of the world's lowest unemployment rates.
Key facts
Unemployment rate fell to 3.9 percent.
Underutilisation rate fell to 11.0 percent.
Employment rate rose to 67.7 percent.
Filled jobs rose 0.4 percent.
Average ordinary time hourly earnings rose to $32.37.
Wage rates increased 2.1 percent annually.
Employment at a glance (seasonally adjusted) | June 2019 quarter | Quarterly change | Annual change | |
Percent | Percentage points | |||
Unemployment rate | 3.9 | -0.3 | -0.5 | |
Underutilisation rate | 11.0 | -0.3 | -1.0 | |
Employment rate | 67.7 | 0.2 | -0.1 | |
Labour force participation rate | 70.4 | 0.0 | -0.6 | |
| (000) | Percent | ||
Unemployed | 109 | -5.8 | -11.2 | |
Employed | 2,680 | 0.8 | 1.7 | |
Filled jobs | 1,972 | 0.4 | 1.0 | |
Working-age population | 3,960 | 0.5 | 1.9 | |
Wages at a glance | Index | Percent | ||
Wage inflation (salary and wage rates, including overtime) | All sectors | 1193 | 0.7 | 2.1 |
Private sector | 1201 | 0.8 | 2.2 | |
Public sector | 1171 | 0.4 | 2.2 | |
LCI analytical unadjusted | 1353 | 1.0 | 3.6 | |
| Level | Percent | ||
Average ordinary time hourly earnings | $32.37 | 1.2 | 4.4 | |
Hours at a glance (figures seasonally adjusted) | Hours | Percent | ||
Average weekly paid hours for FTEs (QES) | Ordinary time | 37.78 | -0.5 | -0.6 |
Total | 38.55 | -0.5 | -0.6 | |
| (million) | Percent | ||
Total weekly paid hours (QES) | 61.8 | 0.2 | 1.1 | |
Total actual weekly hours worked (HLFS) | 91.0 | -0.9 | 1.3 | |
Note: LCI – labour cost index QES – quarterly employment survey HLFS – household labour force survey FTEs – full-time equivalent employees | ||||
Unemployment and underutilisation rates fall, while employment rate rises
The seasonally adjusted unemployment rate fell to 3.9 percent in the June 2019 quarter, down from 4.2 percent last quarter.
This quarter’s unemployment rate is the lowest since June 2008, when it was 3.8 percent.
For men, the unemployment rate fell to 3.6 percent, down from 3.9 percent last quarter. This is the lowest unemployment rate for men since March 2008, when it was also 3.6 percent. For women, the unemployment rate fell to 4.2 percent, down from 4.4 percent last quarter.
PercentUnemployment rate by sex, seasonally adjusted, June 2007–June 2019 quartersMenWomenTotalJun-07Dec-07Jun-08Dec-08Jun-09Dec-09Jun-10Dec-10Jun-11Dec-11Jun-12Dec-12Jun-13Dec-13Jun-14Dec-14Jun-15Dec-15Jun-16Dec-16Jun-17Dec-17Jun-18Dec-18Jun-1934567Stats NZMar-13● Men: 5.1● Women: 6.4● Total : 5.7
The Māori unemployment rate was 7.7 percent in the June 2019 quarter, down from 9.4 percent last year. This reflects a decrease in the number of unemployed Māori (down 6,400). At the same time, the number of Māori who were not in the labour force (NILF) increased (up 14,600).
This is the lowest Māori unemployment rate since the June 2008 quarter, when it was 7.2 percent.
Labour market summary – Māori, June 2019 quarter
The number of unemployed people fell to 109,000 (down 7,000) in the June 2019 quarter. This reflected 4,000 fewer unemployed men, and 2,000 fewer unemployed women.
Annually, there were 13,400 fewer (unadjusted) people unemployed (down 11.1 percent). The number of unemployed people aged 25–29 years fell by 4,800. This was driven entirely by women (down 5,000).
Over the year, the number of unemployed Europeans fell by 13,000 (down 18.5 percent), while the number of unemployed Māori fell by 6,400 (down 19.4 percent).
Employment rate
The employment rate rose to 67.7 percent in the June 2019 quarter, up from 67.5 percent last quarter.
For men, the employment rate rose slightly to 72.4 percent, up from 72.3 percent last quarter. For women, the employment rate rose to 63.1 percent, up from 62.9 percent last quarter. This is the second-highest employment rate for women on record.
The rise in the employment rate reflected the number of people who were employed (up 21,000) increasing by a greater proportion than the working-age population (up 21,000).
In the June 2019 quarter, there were 21,000 more employed people, up to 2,680,000 – 13,000 more women, and 8,000 more men.
Labour market Statistics: March 2019 Quarter
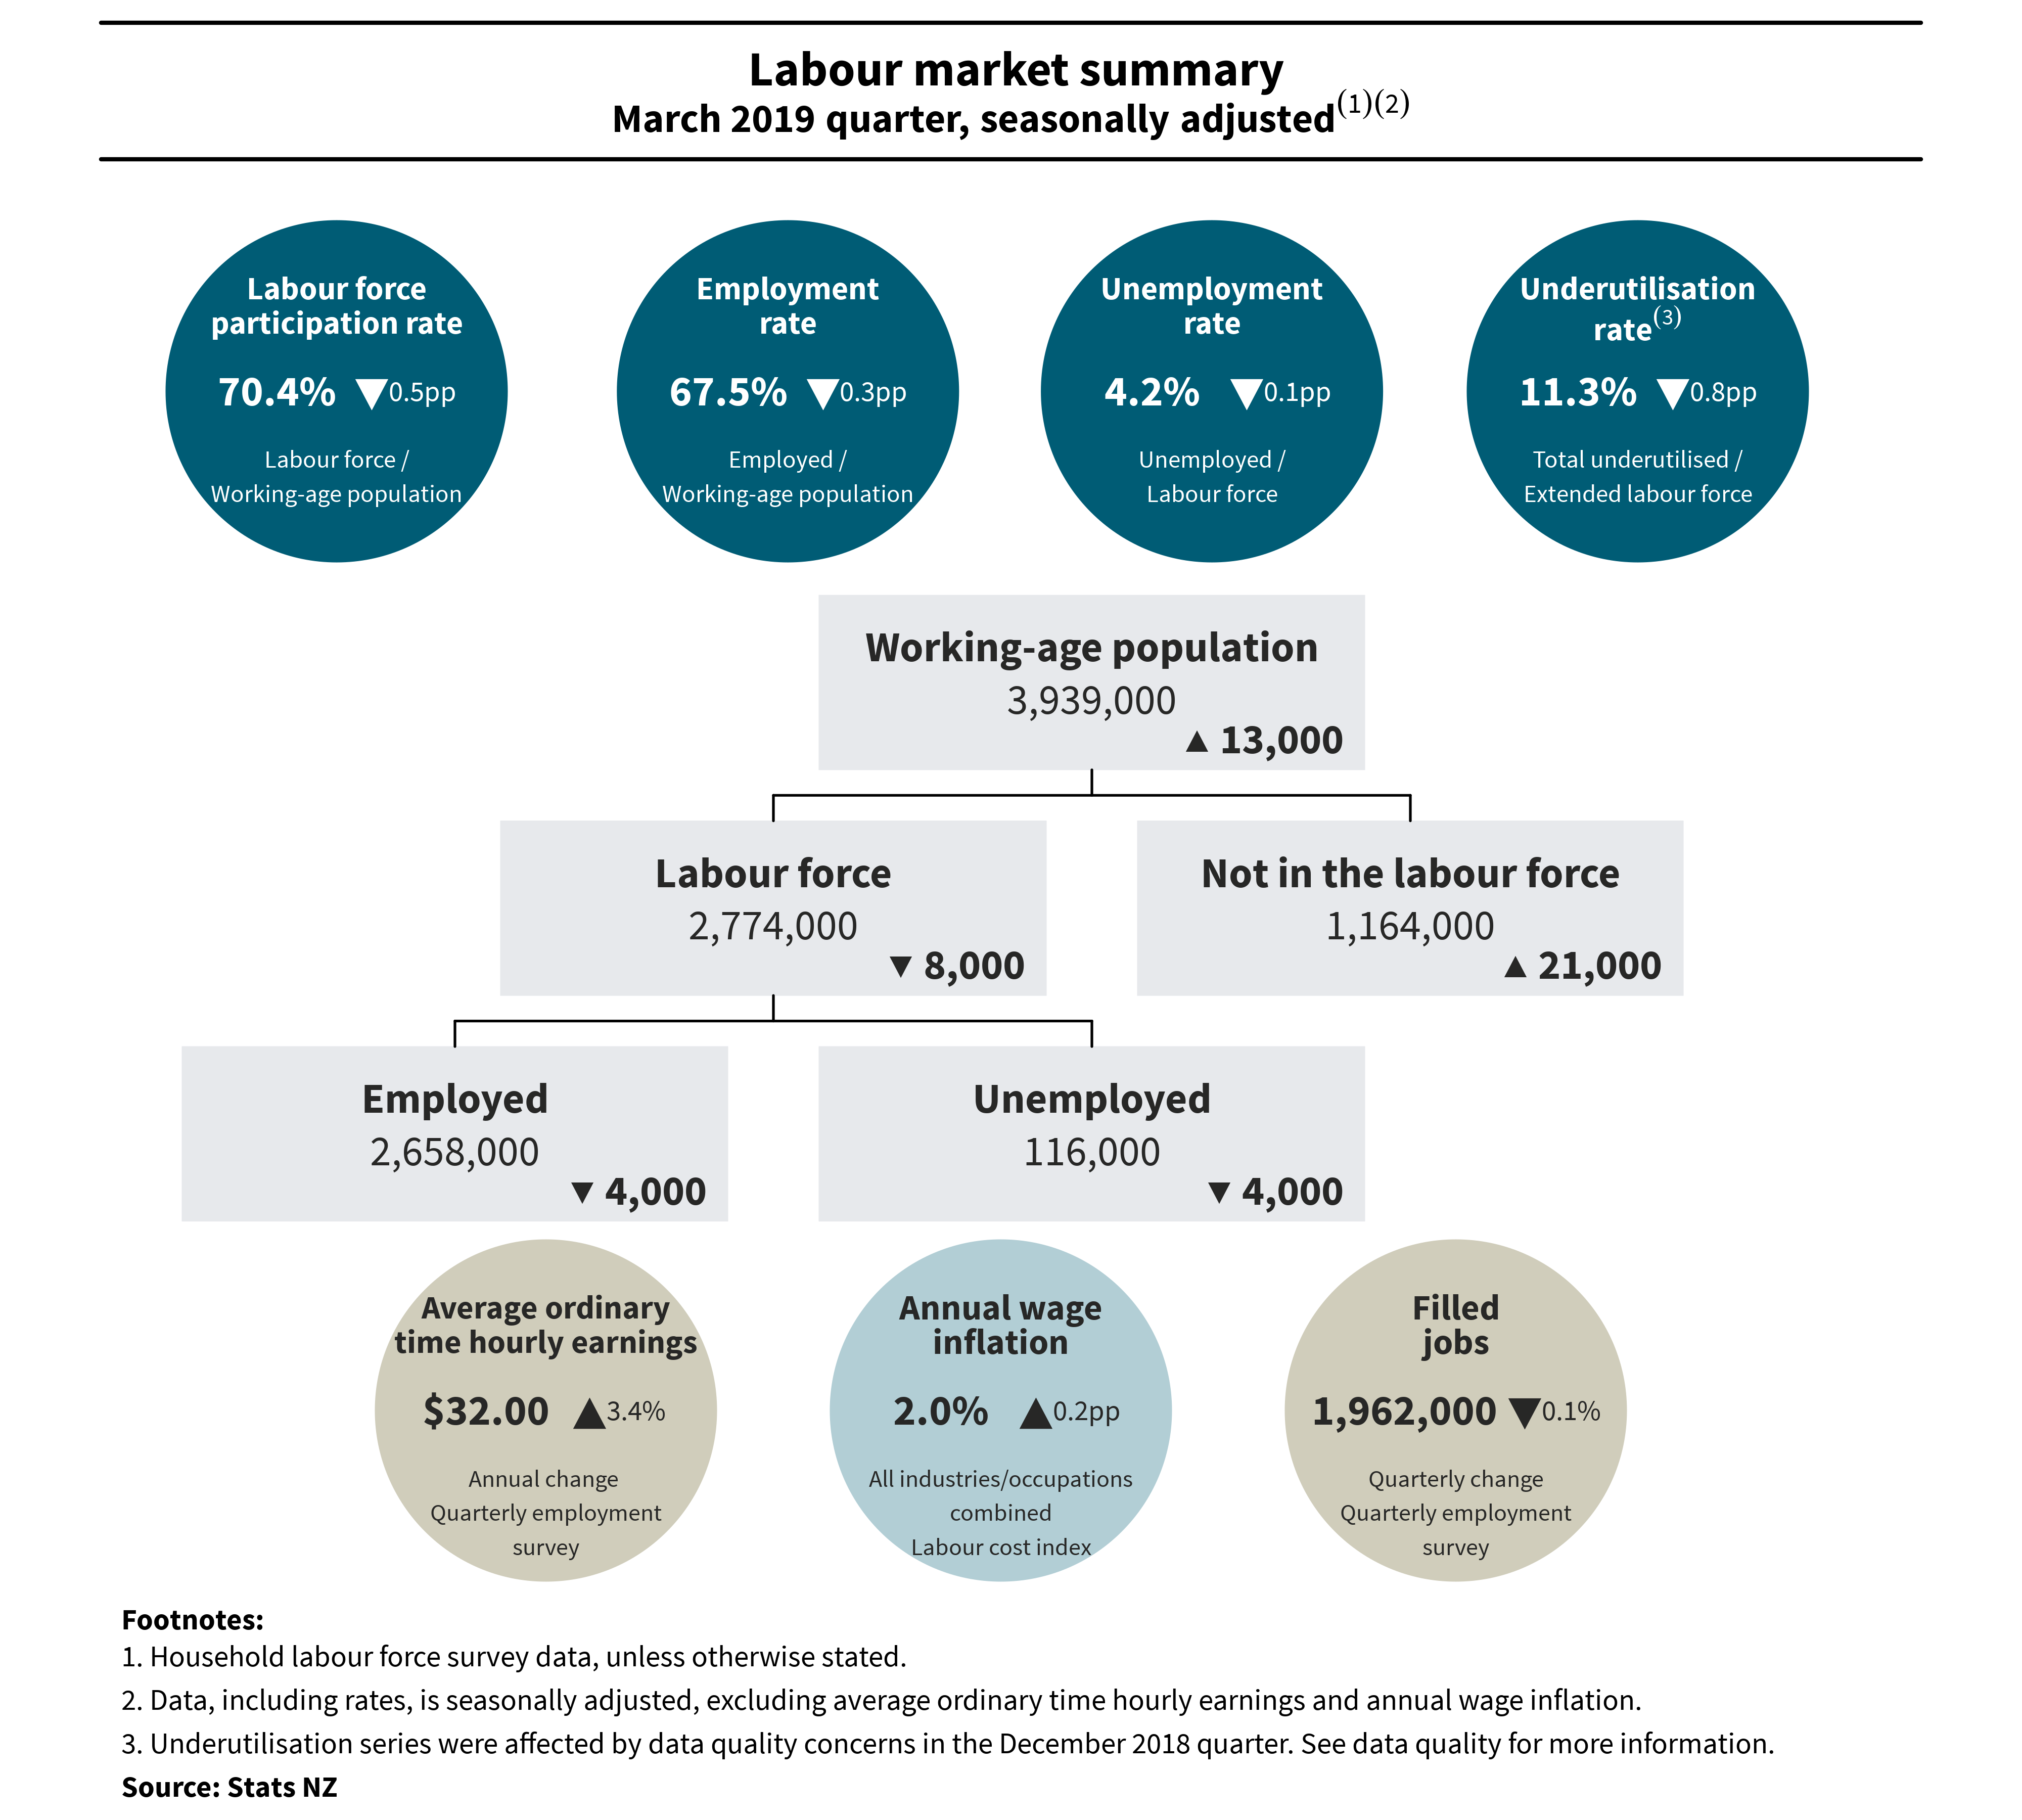
Unemployment rate edges down to 4.2%
01 May, 2019
“The unemployment rate has been mostly trending down since the global financial crisis in 2008,” labour market and household statistics senior manager Jason Attewell said.
“The September 2018 quarter unemployment rate of 4.0 percent was the lowest in a decade.”
The number of people unemployed declined at a faster rate than the number of people in the labour force. This resulted in the unemployment rate falling close to its 10-year low.
The unemployment rate for men was 3.9 percent in the March 2019 quarter, down from 4.4 percent last quarter. For women, it was 4.5 percent, up from 4.2 percent.
The total number of unemployed people in the March 2019 quarter was 116,000. This reflected 7,000 fewer unemployed men and 3,000 more unemployed women.
The underutilisation rate was 11.3 percent in the March 2019 quarter. This is the lowest underutilisation rate since the December 2008 quarter, when it was also 11.3 percent. Underutilisation provides a broader gauge of untapped capacity in New Zealand’s labour market.
In the year to the March 2019 quarter, the number of people underutilised decreased 14,000, to 324,000. There were 8,000 fewer underutilised women and 6,000 fewer underutilised men.
Stats NZ adjusted some December 2018 quarter data, but did not adjust the underutilisation data series. Users are advised to be cautious when drawing comparisons with December 2018 quarter data and to focus on longer-term trends.
Employment rate falls
The employment rate, which reflects the number of people employed as a share of the working-age population (people aged 15 years and older), fell to 67.5 percent in the March 2019 quarter, from 67.8 percent last quarter.
The fall in the employment rate reflected a fall in the number of people employed and a rise in the working-age population.
The employment rate for men fell to 72.3 percent, down from 72.9 percent last quarter. For women, it was 62.8 percent, down from 63.0 percent.
“Generally, employment growth tends to lag broader economic growth by about three months,” Mr Attewell said.
“New Zealand has seen a softening of economic growth as measured by gross domestic product over the last six months, and we now are seeing that softening come through the employment rate.”
The number of employed people increased 38,200 or 1.5 percent (unadjusted) in the year to the March 2019 quarter. Over the same period, filled jobs, as measured by the quarterly employment survey (QES), increased 1.1 percent (unadjusted) – 22,100 more jobs. Of this increase, 18,700 jobs were held by women and 3,400 by men.
Differences between filled jobs in the QES and employment numbers in the household labour force survey (HLFS) can largely be explained by differences in survey coverage. The QES excludes some industries (including agriculture), and people who are self-employed without employees (to better fit international standards). Conversely, the HLFS only includes usually resident New Zealanders, so can exclude some temporary seasonal labourers.
Regional employment
In the March 2019 year, employment grew in the following regions:
Auckland – up 26,600 (2.9 percent)
Manawatu-Wanganui – up 6,000 (5.2 percent)
Wellington – up 11,200 (3.8 percent).
The number of people employed in Canterbury decreased 12,400 (3.6 percent) over the year.
“More than half of the fall in Canterbury’s employment came from the construction industry, influenced by the continued wind-down of the post-earthquake rebuild,” Mr Attewell said.
“The total value of building activity in Canterbury has generally trended down since its peak in mid-2016, according to the latest value of building work put in place data.”
People not in the labour force increases annually
The seasonally adjusted number of people who were not in the labour force (NILF) reached 1,164,000 in the March 2019 quarter. This is the highest number of people who are NILF since the series began in 1986.
Annually, 37,800 (unadjusted) more people were NILF – 25,900 more men were NILF, of which 20,600 were aged 55 and older.
Last quarter, an adjustment was made to some seasonally adjusted data series, including employment and NILF. This quarter, Stats NZ reviewed the adjustment and concluded no changes were needed. Stats NZ will continue to review the data adjustment until the December 2019 quarter.
Wage rates grow over the year
The labour cost index (LCI) salary and wage rates (including overtime) increased 2.0 percent in the March 2019 year, while the unadjusted LCI increased 3.4 percent.
The LCI measures movements in wages for a fixed quantity and quality of labour. This means changes in pay rates due to the performance of employees or promotions are not shown in the index.
The unadjusted LCI, on the other hand, also reflects the change in wages because of a change in quality of work (eg more experience). This series is more comparable with the earnings measures in the QES.
The LCI is often compared with the consumers price index (CPI) to see how wage inflation compares with consumer inflation (ie the change in prices of goods and services bought by households). Annual CPI inflation increased 1.5 percent in the year to the March 2019 quarter.
Annually, public sector and private sector wage inflation both were 2.0 percent.
In 2018, several collective agreements have come into force, which have raised wage inflation, such as the nurses’ collective agreement (signed in August last year).
“We are likely to see further increases to wages over the next couple of quarters, as ongoing pay disputes are settled and the minimum wage increase of $1.20 to $17.70 an hour on 1 April 2019 flows through,” Mr Attewell said.
“Lower-paying industries such as retail, and accommodation and food services are most affected by increases to the minimum wage, so we can expect to see growth in these areas next quarter.”
Within the QES, wages also grew over the year. Average ordinary time hourly earnings increased to $32.00 (up 3.4 percent). Private sector average ordinary time hourly earnings increased 3.7 percent, to $30.00. Public sector average ordinary time hourly earnings increased 2.8 percent, to $40.33.
Average weekly earnings (including overtime) for full-time equivalent employees (FTEs) in the QES also increased on an annual basis – up 3.2 percent to $1,243.78.
Labour Market Statistics: December 2018 Quarter
Unemployment rate up to 4.3 percent
07 February 2019, 10:45am
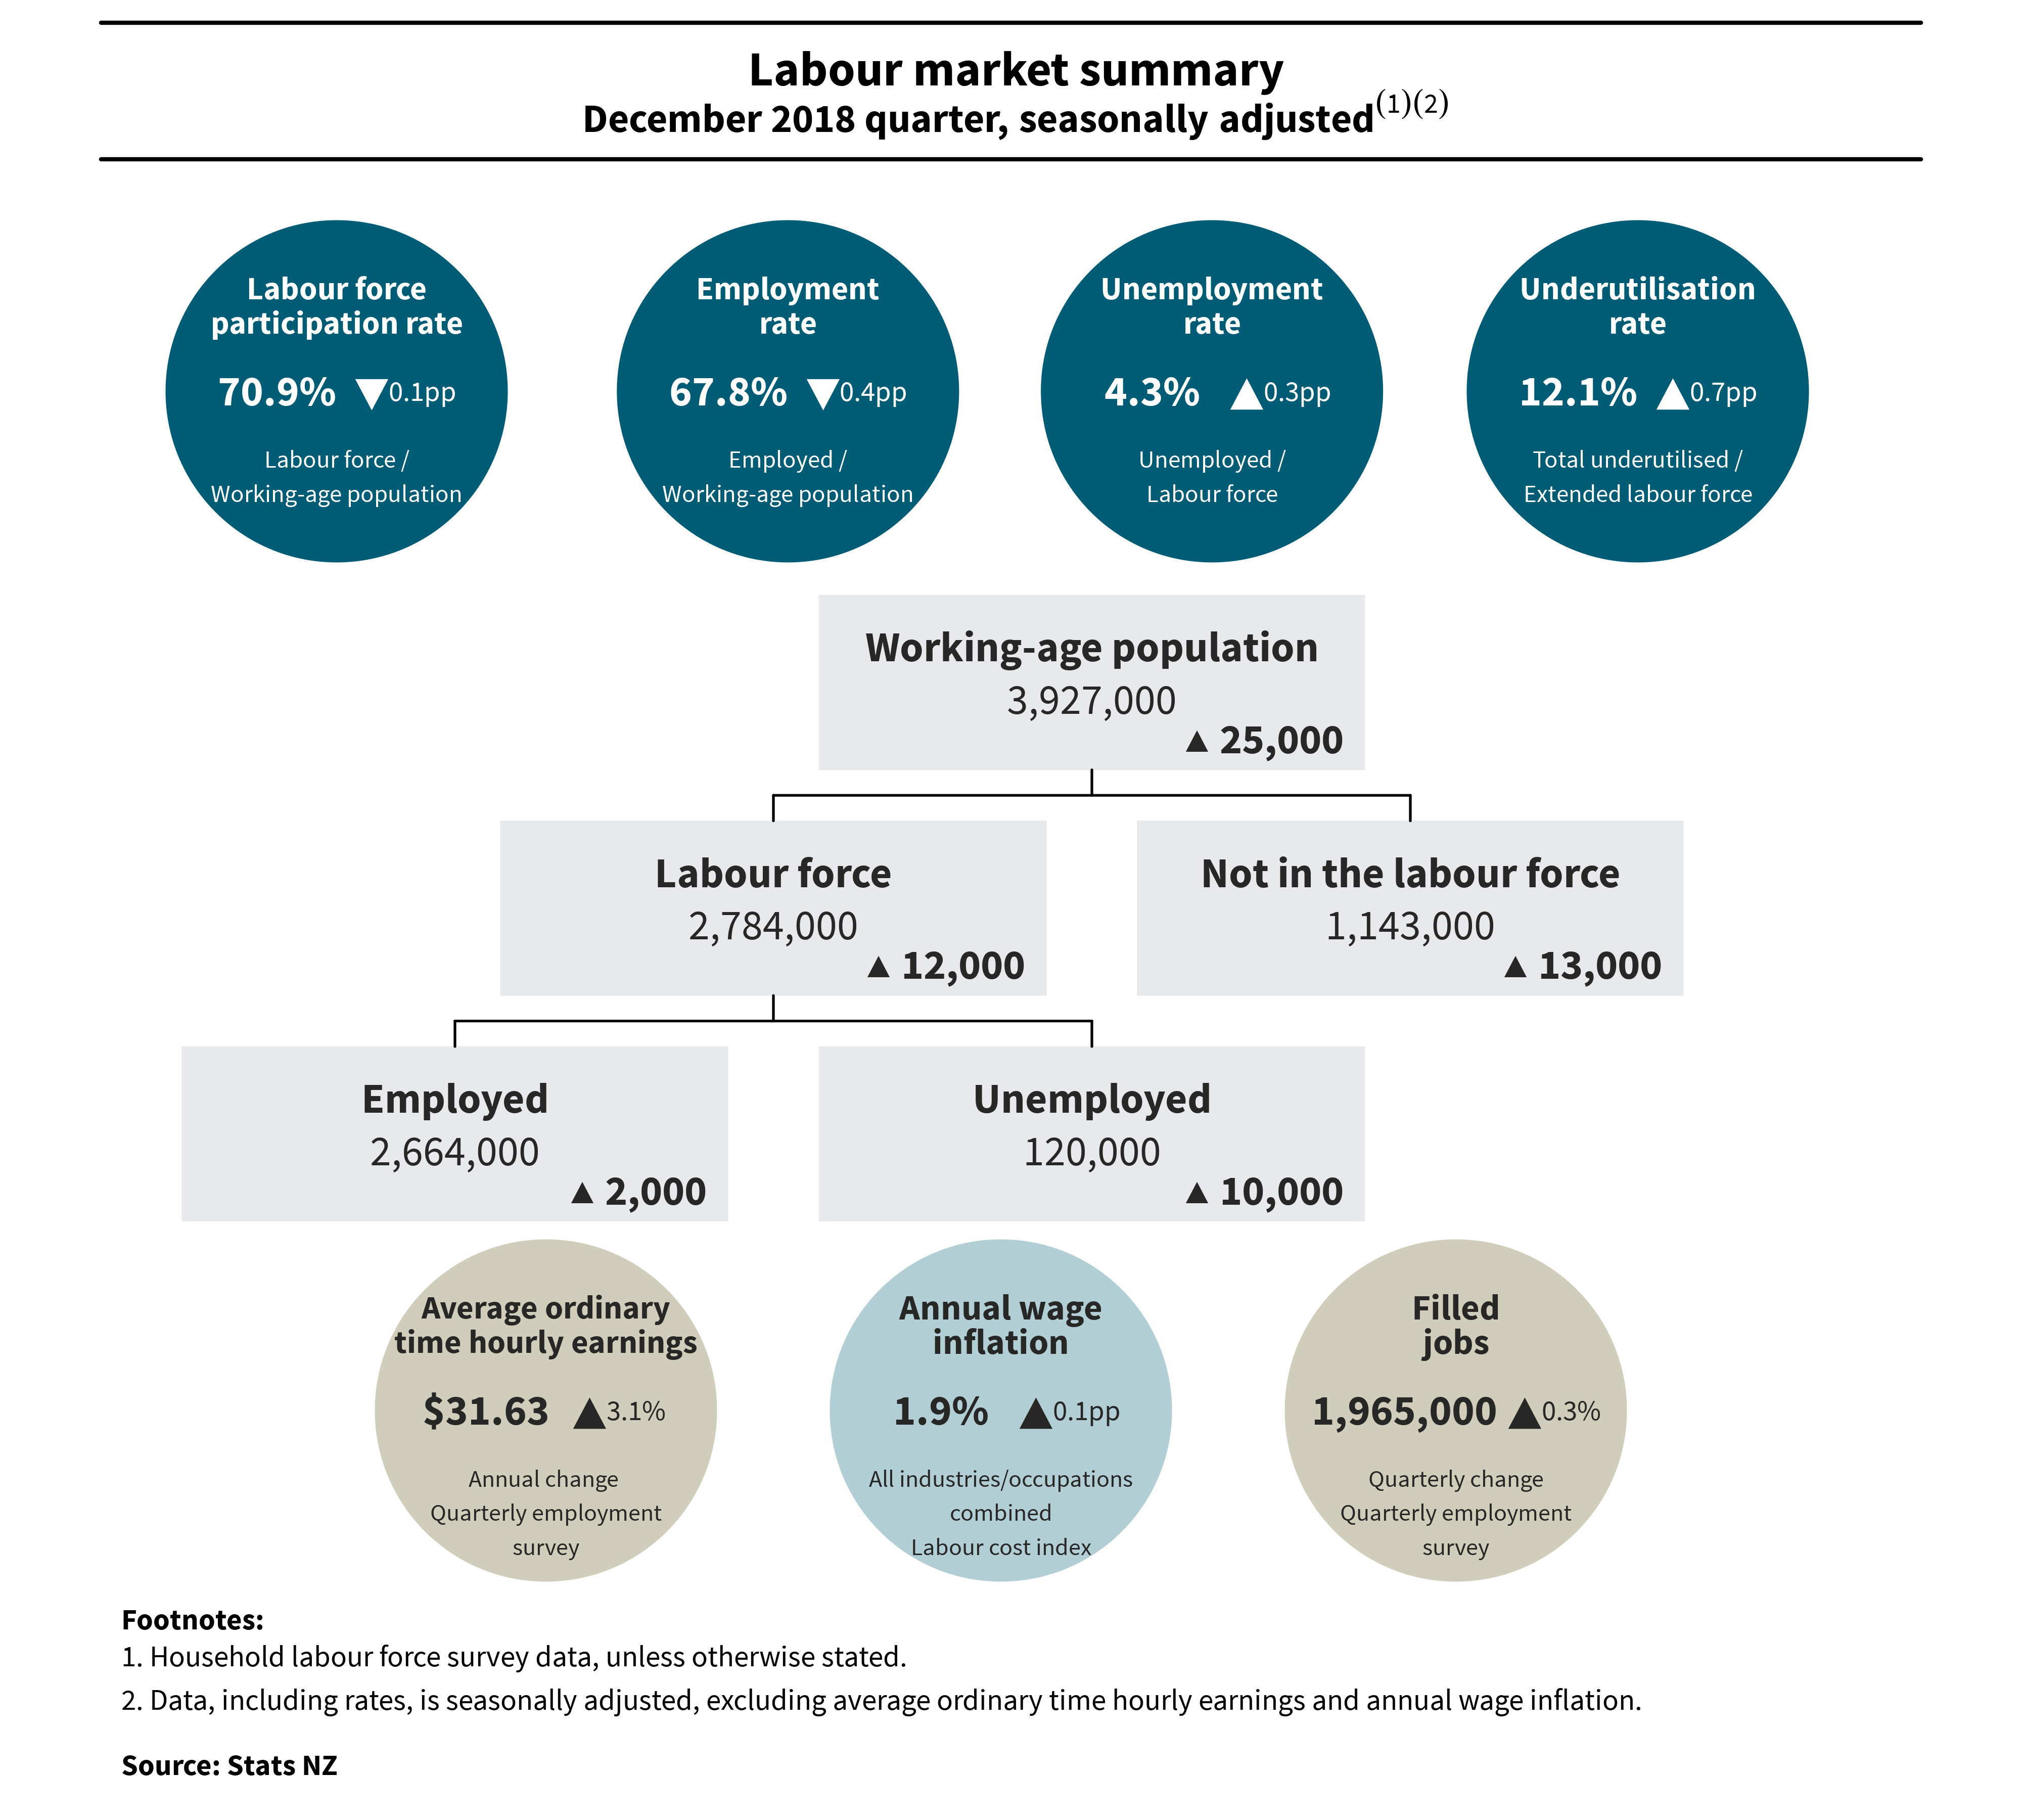
The seasonally adjusted unemployment rate rose to 4.3 percent in the December 2018 quarter, up from 4.0 percent (revised) last quarter, Stats NZ said today.
The rise in the unemployment rate reflected higher growth in unemployment (up 10,000), as a share of the overall growth in the labour force (up 12,000). Unemployment was largely influenced by more unemployed men (up 8,000). For women, unemployment rose 2,000. For men and women combined, there were 12,000 more unemployed youth (15–24-year-olds).
“The unemployment rate for men rose to 4.4 percent in the December quarter, while it was 4.2 percent for women. This was the first time since June 2010 that this rate was lower for women than men,” labour market and household statistics senior manager, Jason Attewell said.
“In the latest quarter, we adjusted some high-level data to improve its accuracy. This included figures for employed people, those not in the labour force, and hours worked. While this is not the first time we’ve made this type of adjustment, it is the first time we’ve done it before publishing. Previously, we made the adjustment a few quarters later,” Mr Attewell said.
“Without the adjustment this quarter, the unemployment rate would have been 4.4 percent rather than 4.3 percent.”
Data adjustment below provides more information about why we made this adjustment and which data should be used with caution.
The underutilisation rate rose to 12.1 percent in the December 2018 quarter, up from 11.4 percent in the previous quarter. This rise mainly reflected higher unemployment and underemployment. Underutilisation provides a broader gauge of untapped capacity in New Zealand’s labour market.
In the latest quarter, growth in the working-age population (up 25,000) outstripped growth in the labour force. This resulted in a slight dip in the labour force participation rate (to 70.9 percent), although it remains high.
The employment rate fell to 67.8 percent, down from its peak of 68.2 percent in the September 2018 quarter, due to stronger growth in the working-age population than for employment.
“The employment rate is now back in line with rates between the September 2017 and June 2018 quarters,” Mr Attewell said.
Annually, filled jobs, as measured by the quarterly employment survey (QES), increased 1.3 percent (unadjusted) – 25,900 more jobs. Of this increase, 24,200 jobs were held by women and 1,800 by men. The key contributing industries were: construction, education and training, retail trade, and wholesale trade.
Differences between filled jobs in the QES and employment numbers in the household labour force survey (HLFS) can largely be explained by differences in survey coverage. The QES excludes some industries (including agriculture), and people who are self-employed without employees (to better fit international standards). Conversely, the HLFS only includes usually resident New Zealanders, so can exclude some temporary seasonal labourers.
Wages grow over the year
The labour cost index (LCI) increased 1.9 percent in the year to the December 2018 quarter, while the analytical unadjusted LCI increased 3.3 percent. Private sector wages were up 2.0 percent, while public sector wages increased 1.7 percent.
Average ordinary time hourly earnings in the QES increased 3.1 percent on an annual basis, to reach $31.63. Private sector average ordinary time hourly earnings were up 3.7 percent (to $29.66), while in the public sector they increased 1.8 percent (to $39.54).
“In the December quarter, the nurses’ pay settlement, which came into effect in August 2018, affected LCI and QES public sector wage and earnings measures. Annual wage inflation reflected the remaining two-thirds of the settlement in the latest quarter. For the QES, the key contributor to the increase in public sector hourly earnings came from hospitals,” Mr Attewell said.
Average total weekly earnings for full-time equivalent employees (FTEs) in the QES increased 2.9 percent annually, to $1,227.85.
AnchorData adjustment
In the December 2018 quarter, the survey of working life (SoWL) accompanied the HLFS. This meant we asked employed people extra questions about their working arrangements and conditions.
Including SoWL coincided with more people than expected reporting they had moved from being ‘employed’ to being ‘not in the labour force’ (NILF) in the unadjusted data.
“We concluded that including SoWL has affected some key variables, such as employment and NILF, which led us to adjust the data,” Mr Attewell said.
We further adjusted 10 high-level seasonally adjusted data series, including: employed, NILF, and hours worked, to improve the accuracy of, and coherence between, the trend and seasonally adjusted series. While selected series were directly adjusted, several more series were also affected. For example, when we adjust the number of men and women employed this affects the total number of people employed. We will monitor these series in future quarters and may revise them.
Some seasonally adjusted employed and NILF series were not further adjusted (eg the number of people employed, broken down by age; underemployment; and youth not in employment, education, and training series). These series may show unrealistic movements this quarter. We recommend users exercise caution when considering the latest data and focus on longer-term trends.
In addition, all actual employed and NILF series, including all age, ethnicity, industry, occupation, and regional breakdowns, should be used with caution.
We made similar adjustments to the previous two quarters in which SoWL was run – the March 2008 and December 2012 quarters. These were implemented in the September 2013 quarter.
Number employedNote: Survey of working life ran with HLFS in Mar 2008, Dec 2012, and Dec 2018 quartersEffect of adjustment on seasonally adjusted employed series, March 2007 to December 2018 quartersAdjustedUnadjustedMar-07Sep-07Mar-08Sep-08Mar-09Sep-09Mar-10Sep-10Mar-11Sep-11Mar-12Sep-12Mar-13Sep-13Mar-14Sep-14Mar-15Sep-15Mar-16Sep-16Mar-17Sep-17Mar-18Sep-182 000k2 200k2 400k2 600k2 800kStats NZ
HLFS data collection in DataInfo+ provides the full list of the affected series and more infor
Labour Market Statistics: September 2018 Quarter
Key facts
Labour market at a glance
The unemployment rate fell to 3.9 percent.
Underutilisation rate fell to 11.3 percent.
The employment rate rose to 68.3 percent.
Filled jobs rose 0.3 percent.
Average ordinary time hourly earnings rose to $31.34.
Wage rates increased 1.8 percent annually.
The seasonally adjusted unemployment rate fell to 3.9 percent in the September 2018 quarter, Stats NZ said today.
This is down from 4.4 percent last quarter and is the lowest unemployment rate since the June 2008 quarter, when it was 3.8 percent.
Automotive Employment NZ recorded New Zealand’s historical low of just 3.4% in 2004. At the time Social Development Minister, Steve Maharey commented, “Reaching a world-leading 3.4 per cent unemployment rate is proof of the economic and social strength of 21st century New Zealand” It now seems New Zealand is well on track to better the world’s lowest unemployment once again.
New Zealand’s impressive unemployment record in graphically demonstrated below. Largely unemployment has remained low and even during the Global Financial Crisis unemployment remained low.
The fall in the unemployment rate in the latest quarter reflected a fall in the number of unemployed people (down 13,000) and a strong rise in employment (up 29,000). This quarter’s employment rate rose to 68.3 percent, the highest rate since the series began more than 30 years ago.
The fall in unemployment, in tandem with a fall in underemployment, was key to the underutilisation rate falling to 11.3 percent.
“While this quarter’s unemployment rate is outside market expectations, we know New Zealand has a small economy with a dynamic labour market, and large changes, both up and down, have happened before – in late 2012 and 2015,” labour market and household statistics senior manager Jason Attewell said.
“We also know labour market measures tend to lag behind other economic indicators, which have shown strong and widespread growth in 2018. We’ve seen population growth in the regions, reports of more job ads, high levels of migration and tourism, growing retail sales, and rising exports.”
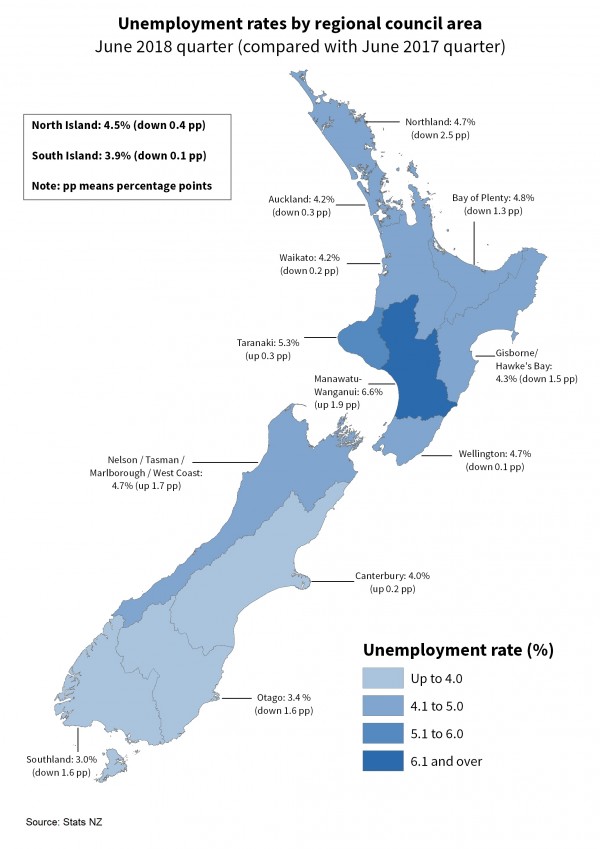
Regional Unemployment and Underutilisation
In the year to the September 2018 quarter, these regions had significant unemployment rate decreases:
Auckland – 3.7 percent (down 0.9 percentage points)
Gisborne/Hawke’s Bay – 4.1 percent (down 4.7 percentage points)
Manawatu-Wanganui – 3.6 percent (down 1.9 percentage points).
Labour Market Statistics: June 2018 Quarter
Key facts
Labour market at a glance
The unemployment rate rose to 4.5 percent.
Underutilisation rate rose to 12.0 percent.
Employment rate was unchanged at 67.7 percent.
Filled jobs rose 0.8 percent.
Average ordinary time hourly earnings increased to $31.00.
Annual wage inflation increased by 1.9 percent.
The number of unemployed men rose 5,000, partly offset by 1,000 fewer unemployed women. This resulted in a total of 124,000 unemployed people in the June 2018 quarter.
The rise in underutilisation reflects nearly equal contributions from people unemployed and underemployed, up 4,000 and 5,000, respectively.
Unemployment and underutilisation
In the June 2018 quarter, the seasonally adjusted unemployment and underutilisation rates both rose slightly.
The unemployment rate rose to 4.5 percent (up 0.1 percentage points).
The underutilisation rate rose to 12.0 percent (up 0.1 percentage points).
The unemployment rate for men rose to 4.3 percent (up 0.3 percentage points), while for women it fell to 4.7 percent (down 0.2 percentage points).
The underutilisation rate for men rose to 10.0 percent (up 0.6 percentage points), while for women, it fell to 14.3 percent (down 0.3 percentage points)he underutilisation rate is just as important as the unemployment rate, as it provides a broader gauge of untapped capacity in New Zealand’s labour market than the unemployment rate alone. It better captures differences in the groups of interest to policy-makers. The number of underemployed men rose to 39,000 (up 4,000), while the number of women underemployed rose to 78,000 (up 1,000). People who are underemployed are those in part-time employment who would like to and are available too, work more hours. In the June 2018 quarter, Southland had the lowest unadjusted regional unemployment rate at 3.0 percent, while Manawatu-Wanganui had the highest at 6.6 percent.
Labour Market Statistics: March 2018 Quarter
Key facts
Labour market at a glance
The unemployment rate fell to 4.4 percent.
Underutilisation rate fell to 11.9 percent.
Employment rate was unchanged at 67.7 percent.
Filled jobs fell 0.2 percent.
Average ordinary time hourly earnings increased to $30.96.
Annual wage inflation remained unchanged at 1.8 percent.
Unemployment, underutilisation, and NEET
In the March 2018 quarter, the seasonally adjusted unemployment and underutilisation rates both fell.
The unemployment rate fell to 4.4 percent, down from 4.5 percent
The underutilisation rate fell to 11.9 percent, down from 12.2 percent
The unemployment rates for men and women fell to 3.9 percent and 4.9 percent, respectively.
The underutilisation rate is as important as the unemployment rate, as it provides a more inclusive view of changes in New Zealand’s labour market than the unemployment rate alone. It better captures differences in the groups of interest to policy-makers.
The fall in underutilisation mainly reflects 9,000 fewer people being underemployed, which includes 8,000 fewer women.
People who are underemployed are those in part-time employment who would like to and are available to work more hours.
The underutilisation rate for women fell to 14.6 percent, down from 15.2 percent in the December 2017 quarter.
The underutilisation rate for men was unchanged, at 9.4 percent.
Compared with the March 2017 quarter, there were 4,500 fewer people underutilised in Gisborne/Hawke’s Bay. This was mainly due to 2,800 fewer underutilised women.
The seasonally adjusted rate for young people (15–24 years) who were not in employment, education, or training (NEET) rose to 12.4 percent, up from 11.8 percent in the December 2017 quarter.
This reflects a rise in the NEET rate for men, to 12.1 percent (from 10.2 percent), which was partly offset by a fall for women, to 12.8 percent (from 13.6 percent).
Employment and the labour force
The employment rate was unchanged in the March 2018 quarter, at 67.7 percent, as employment kept pace with growth in the working-age population. Women were at their highest-ever rate of employment (62.6 percent).
In the latest quarter, employment rose 0.6 percent, the majority of which came from more women (up 0.8 percent) than men (up 0.4 percent) gaining employment. Annually, employment increased 3.1 percent, which was also driven by women (up 3.7 percent) when compared with men (up 2.6 percent).
Compared with the same quarter in 2017, employment growth was strongest in:
Auckland, up 33,700 (3.8 percent)
Otago, up 11,600 (9.8 percent)
Canterbury, up 9,600 (2.8 percent)
Waikato, up 9,300 (3.9 percent).
Industry and occupation
In the March 2018 quarter, 12,000 (0.6 percent) more people were working full time and 3,000 (0.5 percent) more were working part-time. Rises in full-time and part-time work were mainly influenced by women, up 9,000 and 2,000, respectively.
In the year to the March 2018 quarter, the following occupations increased:
managers, up 33,600 (6.8 percent)
professionals, up 29,000 (4.9 percent)
community and personal services workers, up 20,200 (9.3 percent).
The increase in community and personal services workers mainly reflected people working as hospitality workers, emergency service personnel, or personal carers.
Annually, employment (as measured by the HLFS) increased in several industries. The main industries with significant growth were:
professional, scientific, technical, administrative, and support services, up 22,300 (7.2 percent)
retail trade and accommodation services, up 20,100 (5.3 percent)
public administration and safety, up 12,600 (9.1 percent).
Filled jobs (as measured by the QES) increased 1.2 percent (unadjusted) for the year to the March 2018 quarter – 22,400 more jobs. The three main industries contributing to this growth were:
professional, scientific, technical, administrative, and support services, up 12,200 jobs (4.5 percent)
retail trade, up 10,700 (5.5 percent)
education and training, up 9,500 (7.5 percent).
Wages
All the following movements are for the year to the March 2018 quarter.
Average ordinary time hourly earnings in the QES increased 3.5 percent to $30.96, the largest annual increase since the March 2012 quarter. Nearly one-third of this growth came from the healthcare and social assistance, and the professional, scientific, technical, administrative, and support services industries.
Average total weekly earnings for a full-time equivalent employee increased 3.9 percent, to $1,204.85. This was the largest annual increase since the September 2011 quarter.
The number of part-time jobs decreased 4.9 percent over the year, while full-time jobs increased 2.9 percent. A fall in the proportion of people employed part-time can raise average earnings because part-time jobs generally have lower wage rates than full-time positions.
Growth in QES average hourly earnings is often compared with the LCI salary and ordinary time wage rates. However, the QES average earnings statistics reflect not only changes in salary and wage rates, but also compositional changes between and within businesses in surveyed industries (eg people shifting to full-time employment or to higher-paying industries).
Labour Market Statistics: December 2017 Quarter
Key facts
Labour market at a glance
The unemployment rate fell to 4.5 percent.
Underutilisation rate rose to 12.1 percent.
The employment rate remained unchanged at 67.8 percent.
Filled jobs rose 0.3 percent.
Average ordinary time hourly earnings increased to $30.68.Annual wage inflation increased by 1.8 percent
Annual wage inflation increased by 1.8 percent.
Unemployment, underutilisation, and NEET
In the December 2017 quarter, the seasonally adjusted unemployment rate fell to 4.5 percent (down 0.1 percentage points). This is the lowest unemployment rate since the December 2008 quarter. The number of unemployed people fell 4,000, from 126,000 to 122,000.
The unemployment rate for men remained at 4.0 percent, still the lowest since the June 2008 quarter.
The unemployment rate for women fell to 5.0 percent (down 0.3 percentage points from last quarter).
In the December 2017 quarter, the seasonally adjusted not in employment, education, or training (NEET) rate for the 15–24 years age group rose to 11.9 percent (up 0.6 percentage points from last quarter). This mainly reflected a rise in males aged 15–19 years who were not in the labour force, not in education, and not caregiving.
The NEET rate for the 15–19 years age group increased to 8.5 percent (up 1.3 percentage points).
The NEET rate for the 20–24 years age group remained unchanged at 14.8 percent.
Employment and the labour force
In the December 2017 quarter, the labour force participation rate fell to 71.0 percent (down 0.1 percentage points), as growth in the working-age population outpaced growth in the labour force.
The labour force grew 8,000 (up 0.3 percent) people to 2,727,000, while the working-age population grew 18,000 (up 0.5 percent) people to 3,843,000.
The employment rate remained at 67.8 percent, as growth in employment kept pace with growth in the working-age population. This is still the highest rate since the series began in 1986.
In the December 2017 quarter, 13,000 more people were employed full-time (up 0.6 percent), and 1,000 fewer workers were employed part-time (down 0.2 percent), compared with the September 2017 quarter.
Employment by sex, age, and region
For the year ended December 2017, 92,600 more people were employed, with men and women making about equal contributions, up 49,400 (3.7 percent) and 43,300 (3.6 percent), respectively.
Nearly half the annual growth in employment came from those aged 25–34 years, as employment amongst this age group grew 43,300
Labour Market Statistics: September 2017 Quarter
Labour market at a glance
The unemployment rate fell to 4.6 percent.
Underutilisation rate is unchanged at 11.8 percent.
Employment rate rises to 67.8 percent.
Wage rates grow 1.9 percent.
| Employment at a glance (seasonally adjusted) | Sep 2017 quarter | Quarterly change | Annual change | |
| Percent | Percentage points | |||
| Unemployment rate | 4.6 | -0.2 | -0.3 | |
| Employment rate | 67.8 | +1.1 | +1.2 | |
| Labour force participation rate | 71.1 | +1.0 | +1.0 | |
| (000) | Percent | |||
| Unemployed | 126 | -1.2 | -2.0 | |
| Employed | 2,593 | +2.2 | +4.2 | |
| Filled jobs | 1,935 | +0.2 | +2.5 | |
| Working-age population | 3,826 | +0.6 | +2.4 | |
| Wages at a glance | Index | Percent | ||
| Wage inflation (salary and wage rates, including overtime) | All sectors | 1153 | +0.6 | +1.9 |
| Private sector | 1159 | +0.7 | +1.9 | |
| Public sector | 1134 | +0.4 | +1.5 | |
| LCI analytical unadjusted | 1276 | +0.9 | +3.4 | |
| Level | Percent | |||
| Average ordinary time hourly earnings | $30.45 | +1.2 | +2.2 | |
| Hours at a glance (figures seasonally adjusted) | Level | Percent | ||
| Average weekly paid hours for FTEs (QES) | Ordinary time | 37.92 | +0.1 | +0.2 |
| Total | 38.70 | +0.0 | +0.3 | |
| (Million) | Percent | |||
| Total weekly paid hours (QES) | 60.1 | +0.8 | +3.0 | |
| Total actual weekly hours worked (HLFS) | 87.7 | +2.4 | +4.5 | |
| Note: LCI – Labour Cost Index (salary and wage rates) QES – Quarterly Employment Survey HLFS – Household Labour Force Survey | ||||
Unemployment, underutilisation, and NEET
In the September 2017 quarter, the seasonally adjusted unemployment rate fell to 4.6 percent (down 0.2 percentage points from the June quarter), the lowest unemployment rate since the December 2008 quarter. The number of unemployed people fell 2,000 from 128,000 to 126,000.
The unemployment rate for men fell to 4.1 percent (down 0.6 percentage points).
The unemployment rate for women rose to 5.3 percent (up 0.4 percentage points).
percent unemployment rate by sex seasonally adjusted, September 2008 to September 2017Hover to see exact values. Click legend to filter categories.MaleFemaleTotalSep-08Dec-08Mar-09Jun-09Sep-09Dec-09Mar-10Jun-10Sep-10Dec-10Mar-11Jun-11Sep-11Dec-11Mar-12Jun-12Sep-12Dec-12Mar-13Jun-13Sep-13Dec-13Mar-14Jun-14Sep-14Dec-14Mar-15Jun-15Sep-15Dec-15Mar-16Jun-16Sep-16Dec-16Mar-17Jun-17Sep-1734567Source: Stats NZ
The seasonally adjusted underutilisation rate remained at 11.8 percent over the quarter and dropped 0.5 percentage points annually. This annual decrease was primarily due to fewer available potential job seekers (those who wanted to work and were available in the reference week but were not actively applying for jobs).
The underutilisation rate measures the potential labour supply and unmet need for work. An underutilised person may be unemployed, underemployed (wanting more hours), an unavailable jobseeker, or an available potential jobseeker. Looking at the underutilisation rate in combination with the unemployment rate provides a more comprehensive view of New Zealand’s labour market.
The seasonally adjusted not in employment, education, or training (NEET) rate for the 15–24 years age group remained at 11.2 percent over the quarter.
The NEET rate for the 15–19 years age group fell to 7.2 percent (down 1.5 percentage points).
The NEET rate for the 20–24 years age group rose to 14.8 percent (up 1.5 percentage points).
Employment and the labour force
Over the year to September 2017, the employment rate increased to 67.8 percent (up 1.2 percentage points), the highest rate since the series began in 1986. This follows a 0.4 percent contraction in the June 2017 quarter.
This increase is a result of employment growth exceeding growth in the working-age population over the year.
PercentQuarterly employment rateSeptember 2014 to September 2017Hover to see exact values. Click legend to filter categories.TrendSeasonally adjustedSep-14Dec-14Mar-15Jun-15Sep-15Dec-15Mar-16Jun-16Sep-16Dec-16Mar-17Jun-17Sep-176465666768Sep-16● Trend: 66.6● Seasonally adjusted: 66.6Source: Stats NZ
The labour force participation rate rose 1.0 percentage points over the quarter to 71.1 percent, as 54,000 more people entered the labour force.
Employment by sex, age, and ethnicity
Over the year to September 2017 (unadjusted), 102,700 more people were employed (up 4.2 percent). Men and women made roughly equal contributions to the annual increase.
Male employment increased 52,400 (up 4.0 percent).
Female employment increased 50,300 (up 4.3 percent).
87,700 (85.7 percent) of the growth in employment was from those employed full time.
Over half the annual growth in employment came from those aged 25–39, as employment amongst that age group grew 53,200. There was also statistically significant employment growth for those aged 55–59 and 60–64.
Over the year, the ethnicities that changed significantly in employment were:
Asian – up 36,000 (11.3 percent)
Māori – up 21,900 (7.6 percent)
Other – up 23,000 (114.0 percent). This group is primarily made up of those that self-identify ethnically as New Zealanders.
Employment by region
In the year to the September 2017 quarter, the greatest employment growth was in the following regions:
Auckland – up 46,800 (5.5 percent)
Waikato – up 21,600 (9.4 percent)
Bay of Plenty – up 13,300 (9.2 percent)
Wellington – up 10,000 (3.5 percent).
Labour Market Statistics: June 2017 Quarter
Unemployment rate down to 4.8 percent
The seasonally adjusted unemployment rate dropped to 4.8 percent in the June 2017 quarter, falling 0.1 percentage points from 4.9 percent in the March 2017 quarter (down 3,000 people). This is the lowest unemployment rate since the December 2008 quarter, when it was 4.4 percent.
The fall in unemployment over the quarter came primarily from 10,000 fewer women being unemployed. This pushed the female unemployment rate down 0.8 percentage points to 4.9 percent – the lowest unemployment rate for women since the March 2009 quarter.
The male unemployment rate rose by 0.5 percentage points (up 7,000 men) to 4.7 percent in the June 2017 quarter.
Annual unemployment rate down in Nelson/Tasman/Marlborough/West Coast
The only region with a statistically significant annual change in the unemployment rate was the Nelson/Tasman/Marlborough/ West Coast region, which dropped 2.9 percentage points to 3.0 percent. This represents 2,800 fewer unemployed people in the region.
Labour force participation rate down
The labour force participation rate decreased by 0.6 percentage points (down 7,000 people) over the latest quarter, to 70.0 percent. The labour force comprises people in the working-age population who are either employed or unemployed. In the June 2017 quarter, 9,000 fewer women were in the labour force (down 0.7 percent) than in the March 2017 quarter.
The number of people ‘not in the labour force’ (NILF) increased by 26,000 over the June 2017 quarter (up 2.4 percent) – 20,000 of those who joined the NILF group were women.
Employment up over the year
Over the year to the June 2017 quarter, the unadjusted employment rate increased to 66.5 percent (up 0.4 percentage points) from 66.1 percent in the June 2016 quarter. This demonstrated 76,200 more people were employed over the year(up 3.1 percent).
Auckland had a statistically significant increase of 35,700 more people in employment over the June 2017 year (up 4.2 percent). Significant employment growth also occurred in Waikato (14,200 people, up 6.2 percent); Otago (5,800 people, up 5.1 percent); and Wellington (12,500, up 4.4 percent).
PercentRegionAnnual change in regional contribution to employment growthJune 2016 to June 2017AucklandWaikatoWellingtonOtagoCanterburyTasman / Nelson / Marlborough / We…Bay of PlentyNorthlandTaranakiGisborne/Hawke’s BayManawatu/WanganuiSouthland-1001020304050Source: Stats NZ
Employment up across multiple industries
Over the June 2017 year, several industries (as measured by the HLFS) had significant employment growth:
professional, scientific, technical, administration and support services industry up 31,600 (11.1 percent)
construction up 18,000 (8.3 percent)
education and training up 16,700 (7.8 percent)
transport, postal, and warehousing up 11,700 (12.4 percent)
rental, hiring, and real estate services up 10,100 (24.4 percent).
Unadjusted filled jobs (as measured by the QES) increased 3.0 percent (up 56,600 jobs) over the year. By industry, the main contributors to this growth were:
professional, scientific, technical, administration, and support services (up 23,000 jobs)
construction (up 18,200 jobs)
accommodation and food services (up 15,600 jobs).
March 2017 Quarter
Unemployment rate below 5 percent
In the March 2017 quarter, the seasonally adjusted unemployment rate fell 0.3 percentage points to 4.9 percent. The fall reflected 6,000 fewer people being unemployed over the quarter.
People who are unemployed are those who are available to work, and had either actively sought work or had a new job to start within the next four weeks.
Compared with the March 2016 quarter, the unemployment rate also dropped 0.3 percentage points, from 5.2 percent, and there were 1,000 fewer people unemployed.
The trend series shows the unemployment rate was 5.0 percent, down from 5.1 percent in the December 2016 quarter and 5.2 percent a year ago. The trend series removes both the seasonal and irregular component of the series and reveals the underlying direction of movement.
PercentUnemployment rateQuarterly, March 2008 – 2017TrendSeasonally adjustedMar-08Mar-09Mar-10Mar-11Mar-12Mar-13Mar-14Mar-15Mar-16Mar-1734567Source: Stats NZ
Fewer men unemployed
The fall in the number of people unemployed over the latest quarter came primarily from fewer men being unemployed. The seasonally adjusted number of unemployed men fell 11.7 percent (8,000 men) over the quarter, which pushed their unemployment rate down 0.6 percentage points, to 4.2 percent. This is the lowest unemployment rate for men since the December 2008 quarter, when it was also 4.2 percent.
There was a 2.5 percent increase in the number of women (2,000) unemployed over the March 2017 quarter, but their unemployment rate was unchanged, at 5.7 percent.
Fewer underutilised people in the labour market
Underutilisation is a measure of the potential labour supply and unmet need for work. An underutilised person may be unemployed, underemployed, an unavailable jobseeker, or an available potential jobseeker.
In the March 2017 quarter, the unadjusted underutilisation rate fell 0.3 percentage points (not significant), to 12.5 percent. This represented 8,200 fewer people (not significant) being underutilised, with a significant decrease of 9,500 unavailable job seekers (these are people who have been actively seeking work but were not available to start immediately).
Employment growth continues to outpace population growth
In the March 2017 quarter, seasonally adjusted employment rose 1.2 percent, with 29,000 more people employed than in the December 2016 quarter. In that quarter, there was a 0.7 percent increase from the September 2016 quarter.
The working-age population increased by 0.7 percent (up 27,000 people) in the latest quarter, to reach 3,782,000. Growth in employment in the quarter exceeded growth in the working-age population for the sixth quarter in a row. The continued employment growth, relative to population growth, resulted in a 0.3 percentage-point increase in the employment rate, to 67.1 percent.
Percentage change working-age population and employmentSeasonally adjusted, quarterlyPersons employedWorking-age PopulationMar-11Mar-12Mar-13Mar-14Mar-15Mar-16Mar-17-10123Source: Stats NZ
The number of people participating in the labour force grew 0.9 percent (23,000 more people), to reach 2,671,000. The labour force comprises all those in the working-age population who were either employed or officially unemployed.
The increase in the labour force was due to more people being employed, as the number of unemployed people fell.
More men in both full-time and part-time employment
Overall, in seasonally adjusted terms, 12,000 more people were in full-time and 16,000 more in part-time employment in the March 2017 quarter.
The seasonally adjusted number of men employed increased by 1.5 percent (up 20,000). The number in full-time employment rose 1.0 percent (11,000) and the number in part-time employment rose 6.2 percent (up 10,000).
The seasonally adjusted number of employed women rose 0.7 percent (up 9,000). The number of women in part-time employment increased 1.9 percent (up 7,000), and was up 0.1 percent (1,000) for full-time employment.
Note: The seasonally adjusted employed series for men and women total do not equal the sum of the seasonally adjusted full-time and part-time series because these series are adjusted separately.
Self-employment on the rise
In the March 2017 quarter, the number of self-employed people (without employees) increased significantly – up 8.9 percent (24,700) to reach 302,200.
This increase is one reason why employment growth indicators from the Household Labour Force Survey (HLFS) are notably higher than those the Quarterly Employment Survey (QES) produces. The QES showed a 0.3 percent increase in seasonally filled jobs (as reported by businesses) in the March 2017 quarter, below the 1.2 percent increase in the number of people employed (HLFS).
The two surveys are different conceptually and in scope. Key differences in coverage are that the QES excludes certain industries, self-employment (without employees), and unpaid family workers. It is possible to produce a ‘comparable’ series of the HLFS that excludes these same components. Doing this, seasonally adjusted employment growth is 0.5 percent over the quarter instead, which is much closer to the increase in filled jobs (0.3 percent).
Accommodation and food services, and construction, drive annual increase in jobs
Over the year to the March 2017 quarter, unadjusted filled jobs (as reported by the QES) increased 2.5 percent (up 46,200). These industries made the largest contributions to the increase:
accommodation and food services (up 16,200)
construction (up 16,100)
professional, scientific, technical, admin and support services (up 12,700).